

Athletic apparel brand Nike (NYSE:NKE) reported revenue ahead of Wall Street’s expectations in Q1 CY2025, but sales fell by 9.3% year on year to $11.27 billion. Its GAAP profit of $0.54 per share was 94.9% above analysts’ consensus estimates.
Is now the time to buy Nike? Find out by accessing our full research report, it’s free.
Nike (NKE) Q1 CY2025 Highlights:
- Revenue: $11.27 billion vs analyst estimates of $11.02 billion (9.3% year-on-year decline, 2.3% beat)
- EPS (GAAP): $0.54 vs analyst estimates of $0.28 (94.9% beat)
- Operating Margin: 7.3%, down from 10.7% in the same quarter last year
- Constant Currency Revenue fell 7% year on year (0% in the same quarter last year)
- Market Capitalization: $108 billion
"The progress we made against the 'Win Now' strategic priorities we committed to 90 days ago reinforces my confidence that we are on the right path," said Elliott Hill, President and CEO of Nike.
Company Overview
Originally selling Japanese Onitsuka Tiger sneakers as Blue Ribbon Sports, Nike (NYSE:NKE) is a global titan in athletic footwear, apparel, equipment, and accessories.
Footwear
Before the advent of the internet, styles changed, but consumers mainly bought shoes by visiting local brick-and-mortar shoe, department, and specialty stores. Today, not only do styles change more frequently as fads travel through social media and the internet but consumers are also shifting the way they buy their goods, favoring omnichannel and e-commerce experiences. Some footwear companies have made concerted efforts to adapt while those who are slower to move may fall behind.
Sales Growth
A company’s long-term sales performance is one signal of its overall quality. Any business can have short-term success, but a top-tier one grows for years. Unfortunately, Nike’s 3% annualized revenue growth over the last five years was weak. This fell short of our benchmarks and is a poor baseline for our analysis.
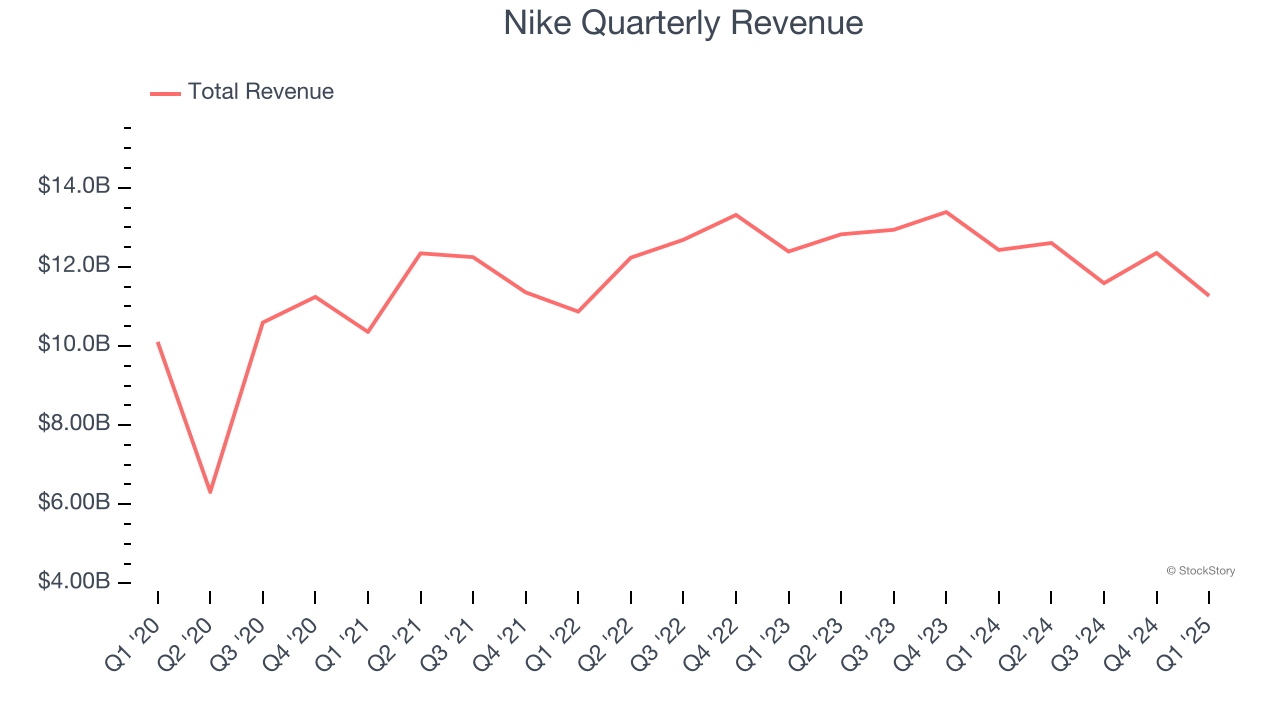
Long-term growth is the most important, but within consumer discretionary, product cycles are short and revenue can be hit-driven due to rapidly changing trends and consumer preferences. Nike’s history shows it grew in the past but relinquished its gains over the last two years, as its revenue fell by 2.8% annually. 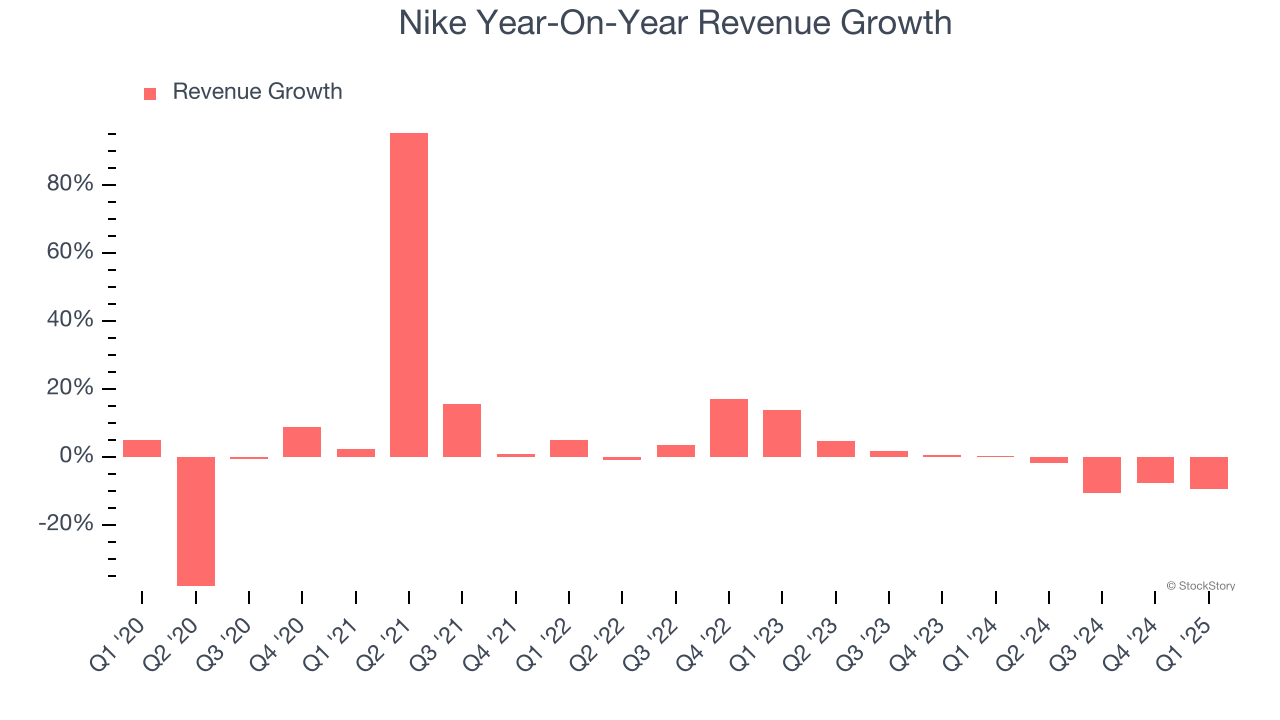
We can dig further into the company’s sales dynamics by analyzing its constant currency revenue, which excludes currency movements that are outside their control and not indicative of demand. Over the last two years, its constant currency sales averaged 2% year-on-year declines. Because this number aligns with its normal revenue growth, we can see that Nike has properly hedged its foreign currency exposure. 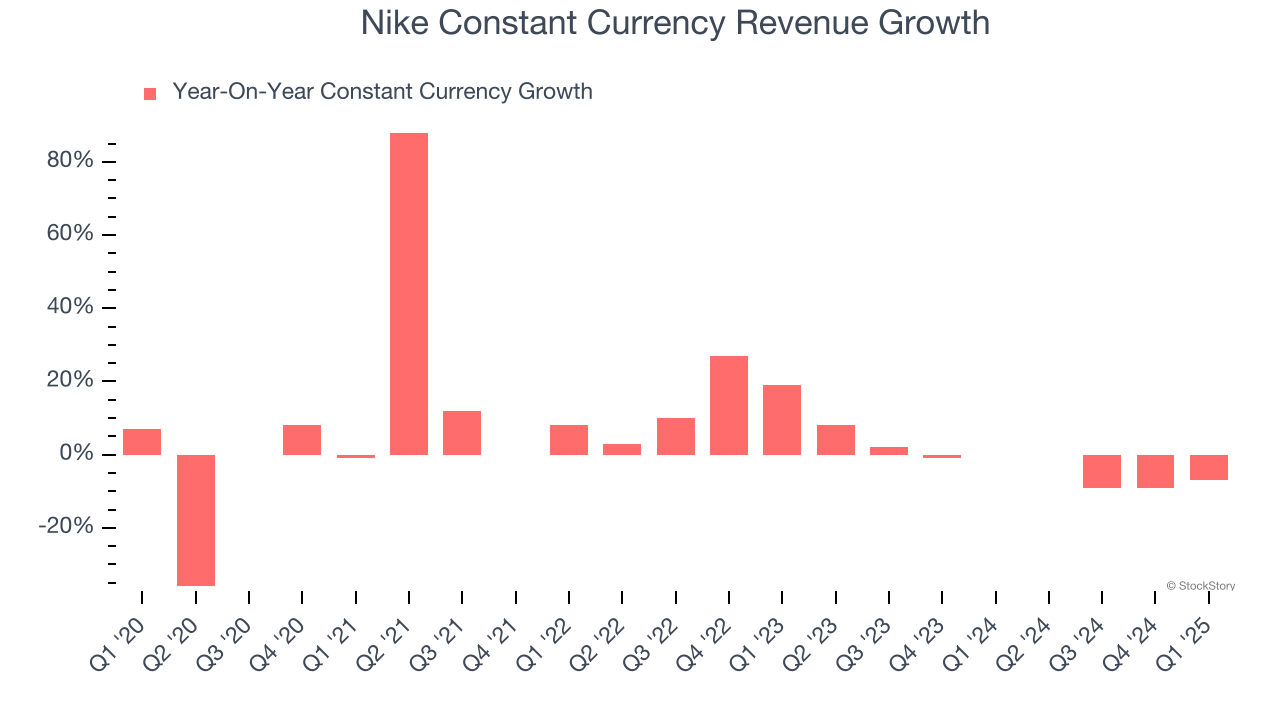
This quarter, Nike’s revenue fell by 9.3% year on year to $11.27 billion but beat Wall Street’s estimates by 2.3%.
Looking ahead, sell-side analysts expect revenue to decline by 4.3% over the next 12 months, similar to its two-year rate. This projection is underwhelming and indicates its products and services will see some demand headwinds.
Software is eating the world and there is virtually no industry left that has been untouched by it. That drives increasing demand for tools helping software developers do their jobs, whether it be monitoring critical cloud infrastructure, integrating audio and video functionality, or ensuring smooth content streaming. Click here to access a free report on our 3 favorite stocks to play this generational megatrend.
Operating Margin
Operating margin is an important measure of profitability as it shows the portion of revenue left after accounting for all core expenses – everything from the cost of goods sold to advertising and wages. It’s also useful for comparing profitability across companies with different levels of debt and tax rates because it excludes interest and taxes.
Nike’s operating margin has shrunk over the last 12 months, but it still averaged 11% over the last two years, decent for a consumer discretionary business. This shows it generally does a decent job managing its expenses.
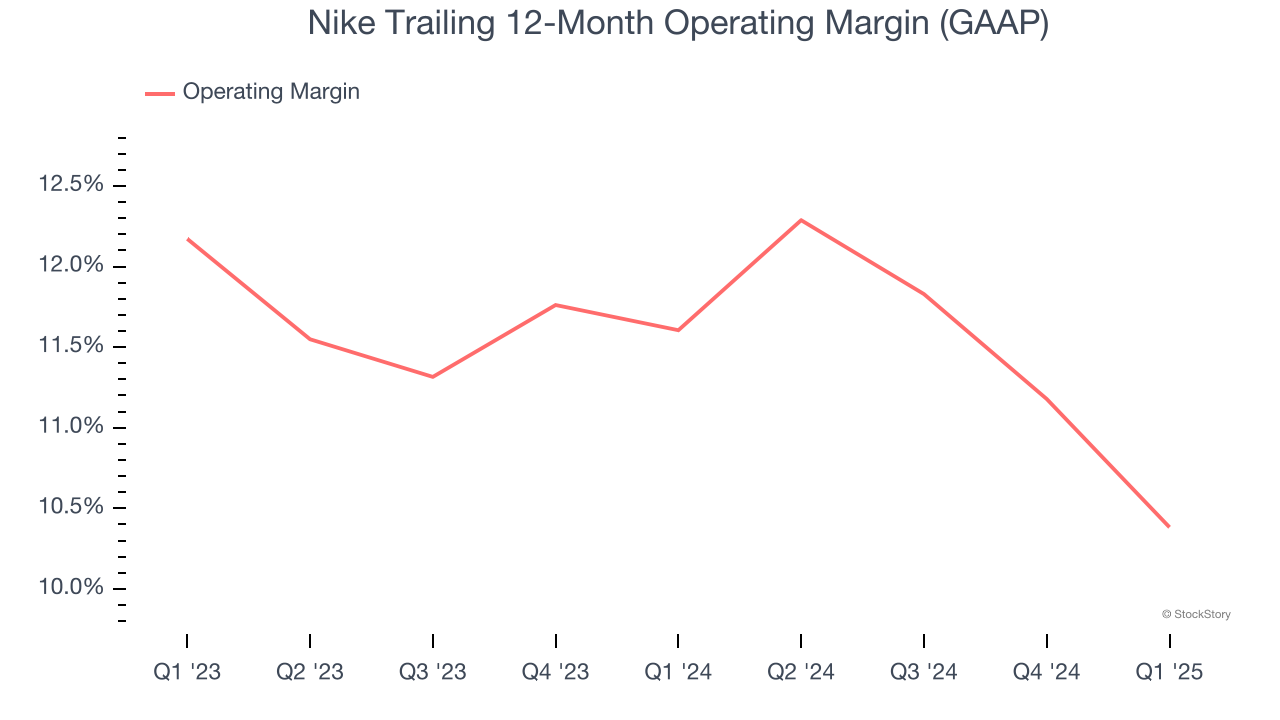
In Q1, Nike generated an operating profit margin of 7.3%, down 3.4 percentage points year on year. This contraction shows it was less efficient because its expenses increased relative to its revenue.
Earnings Per Share
Revenue trends explain a company’s historical growth, but the long-term change in earnings per share (EPS) points to the profitability of that growth – for example, a company could inflate its sales through excessive spending on advertising and promotions.
Nike’s weak 2.1% annual EPS growth over the last five years aligns with its revenue performance. This tells us it maintained its per-share profitability as it expanded.
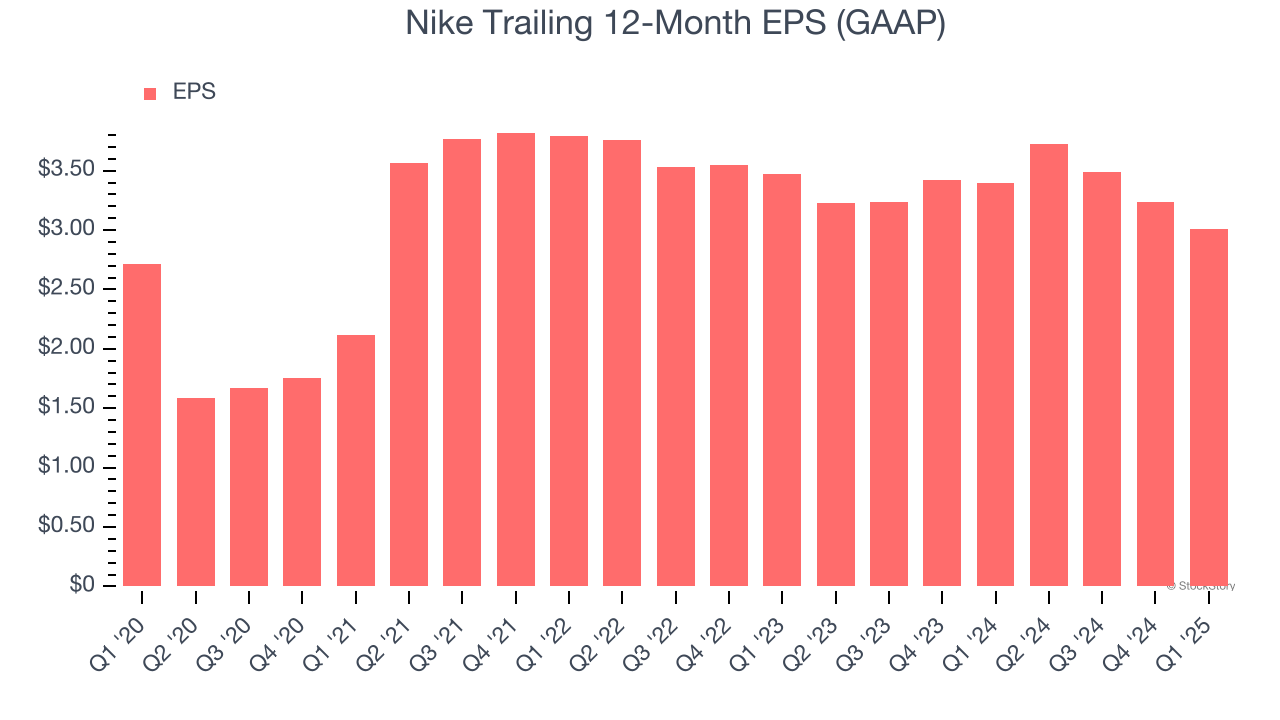
In Q1, Nike reported EPS at $0.54, down from $0.77 in the same quarter last year. Despite falling year on year, this print easily cleared analysts’ estimates. Over the next 12 months, Wall Street expects Nike’s full-year EPS of $3.01 to shrink by 32.8%.
Key Takeaways from Nike’s Q1 Results
We were impressed by how significantly Nike blew past analysts’ EPS expectations this quarter. We were also glad its constant currency revenue outperformed Wall Street’s estimates. Zooming out, we think this was a good quarter with some key areas of upside. The stock traded up 4.2% to $74.90 immediately after reporting.
Nike had an encouraging quarter, but one earnings result doesn’t necessarily make the stock a buy. Let’s see if this is a good investment. We think that the latest quarter is only one piece of the longer-term business quality puzzle. Quality, when combined with valuation, can help determine if the stock is a buy. We cover that in our actionable full research report which you can read here, it’s free.